
Experiences at a glance
If you don’t share your ideas, no one will know if they’re any good
Though actually doing web design, graphic design, SEO, BI and Multimedia is not my main area of focus anymore, it sure is fun to do! Here are a handful of items from my portfolio over the last 15 years.
From Information to Organizational Flow
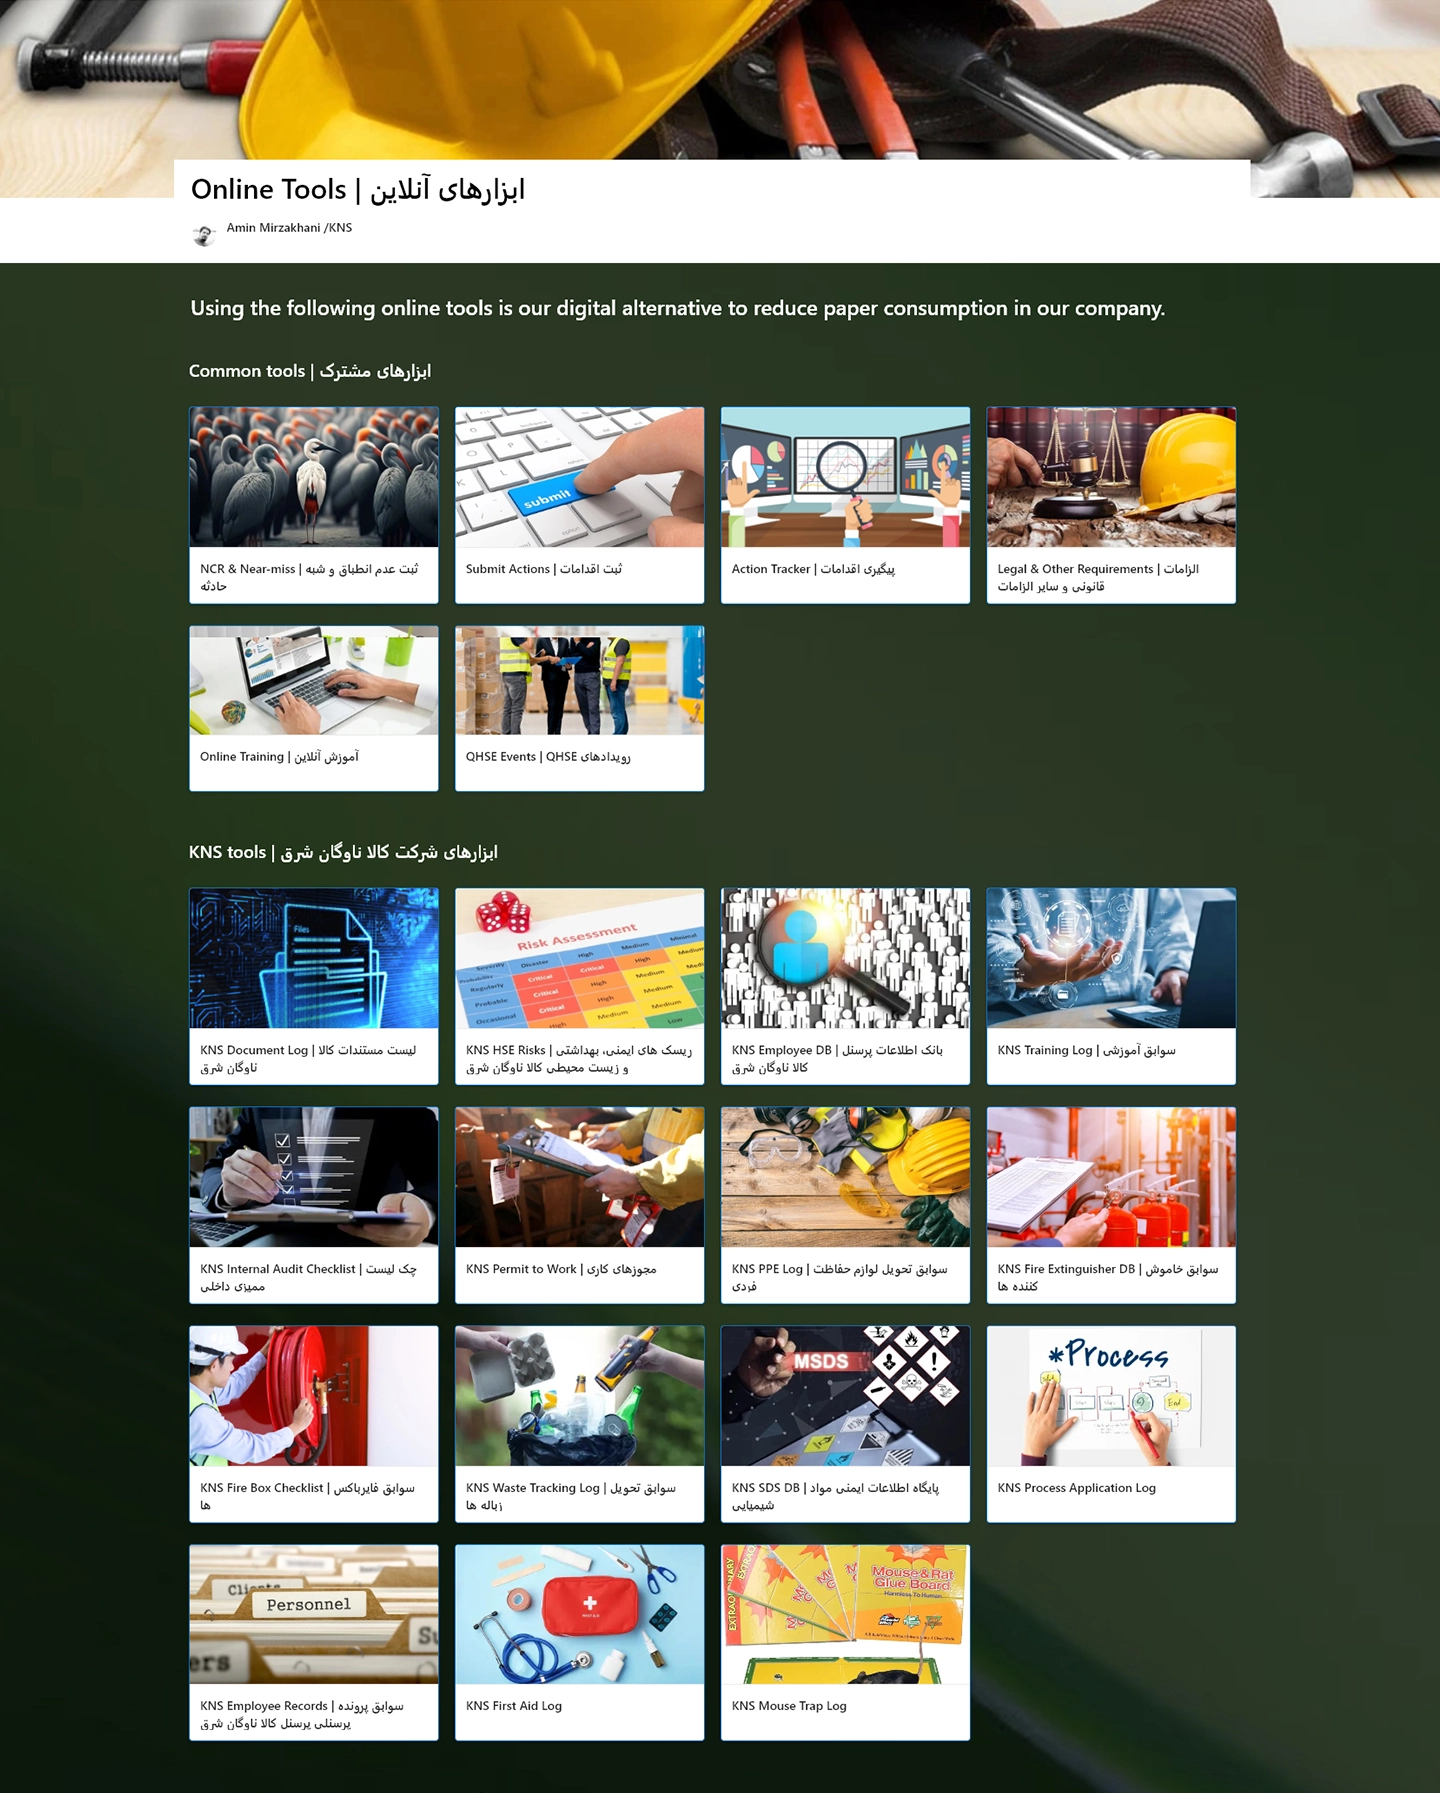
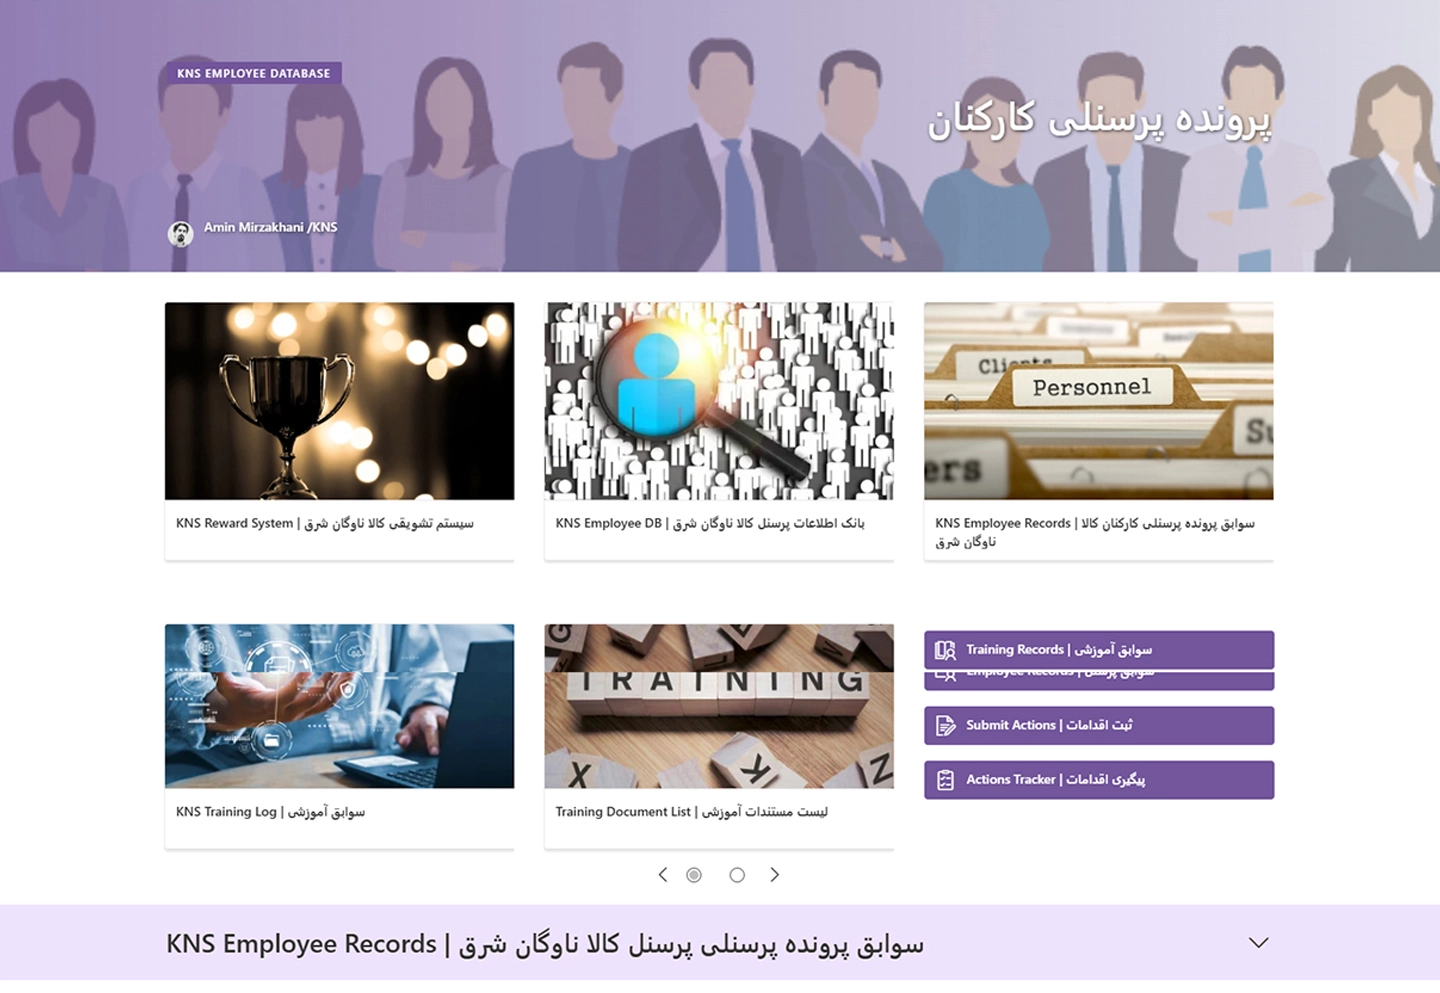
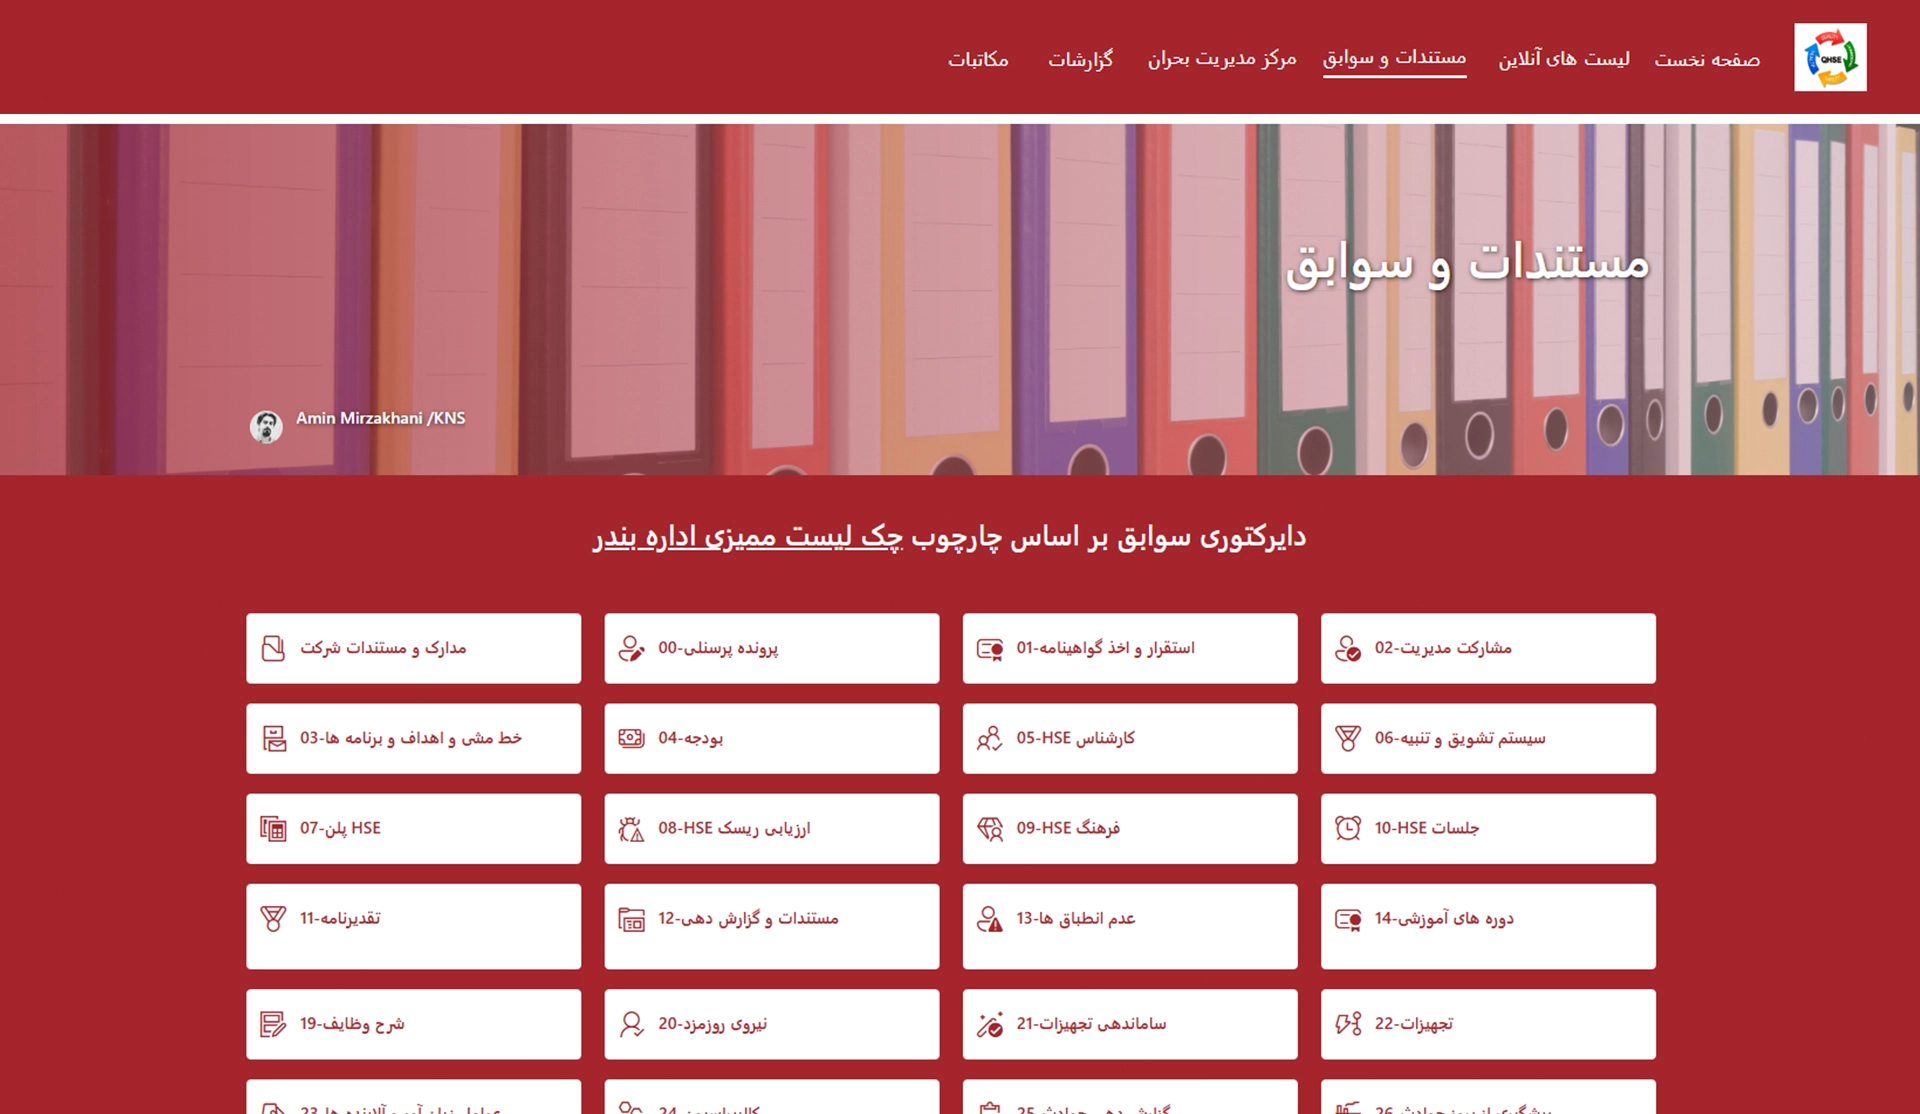
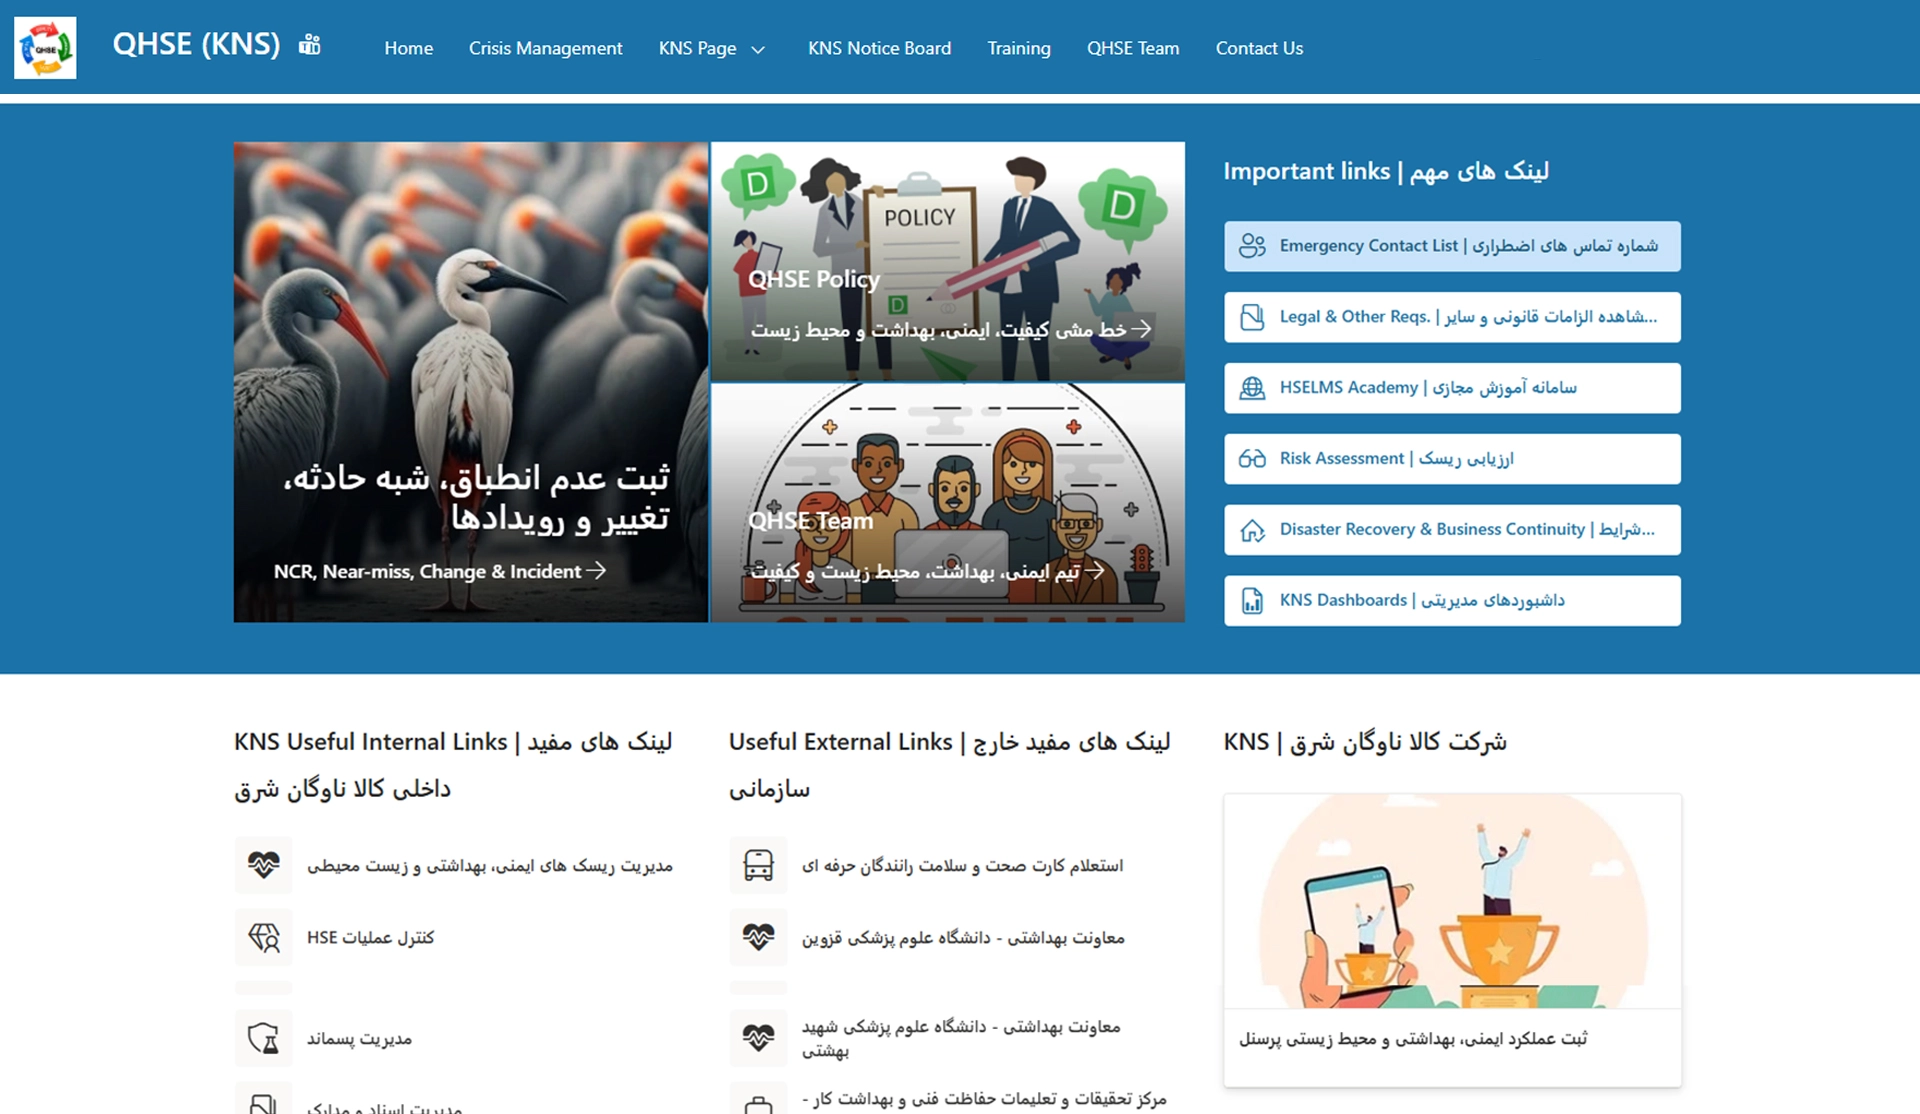
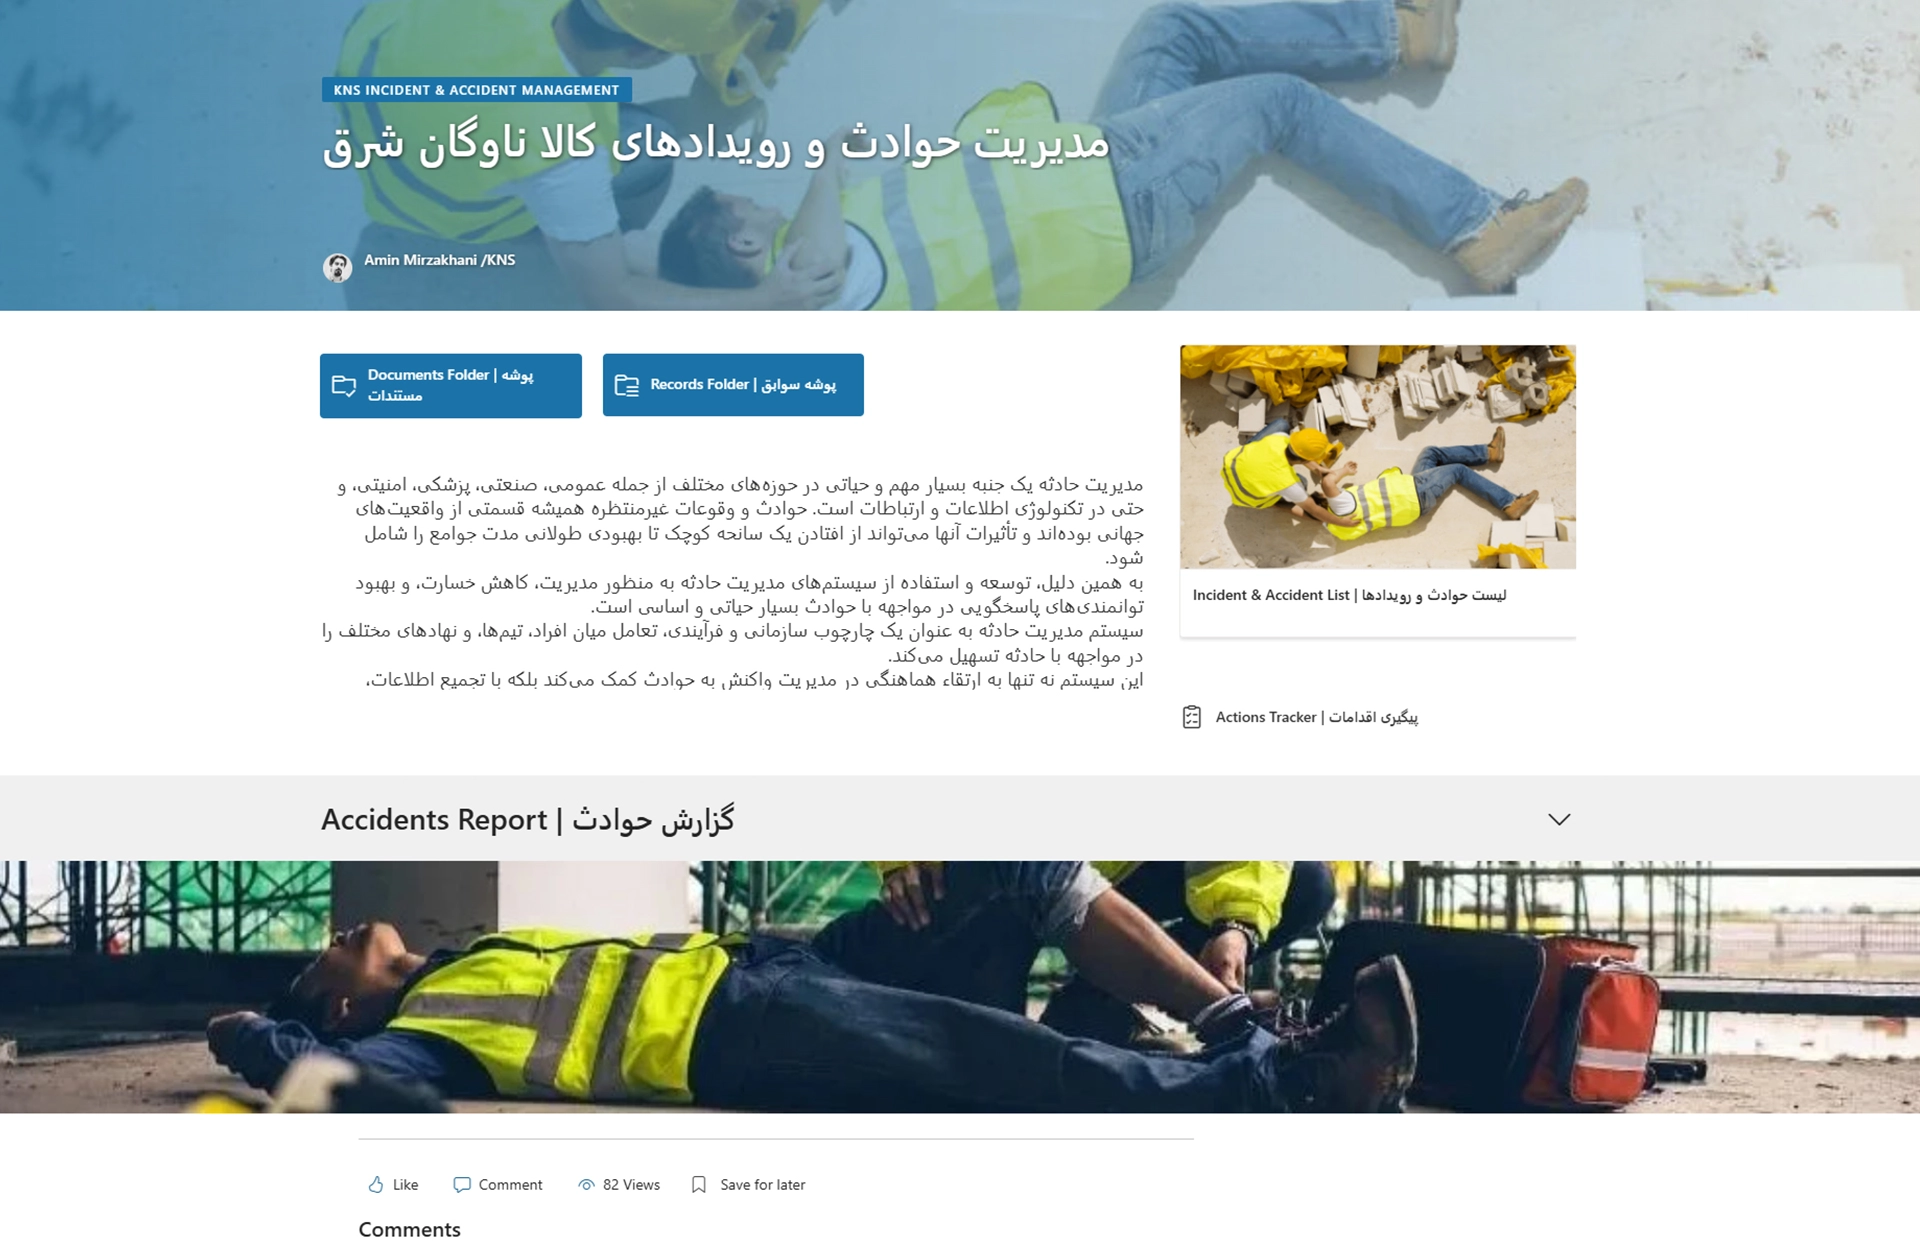
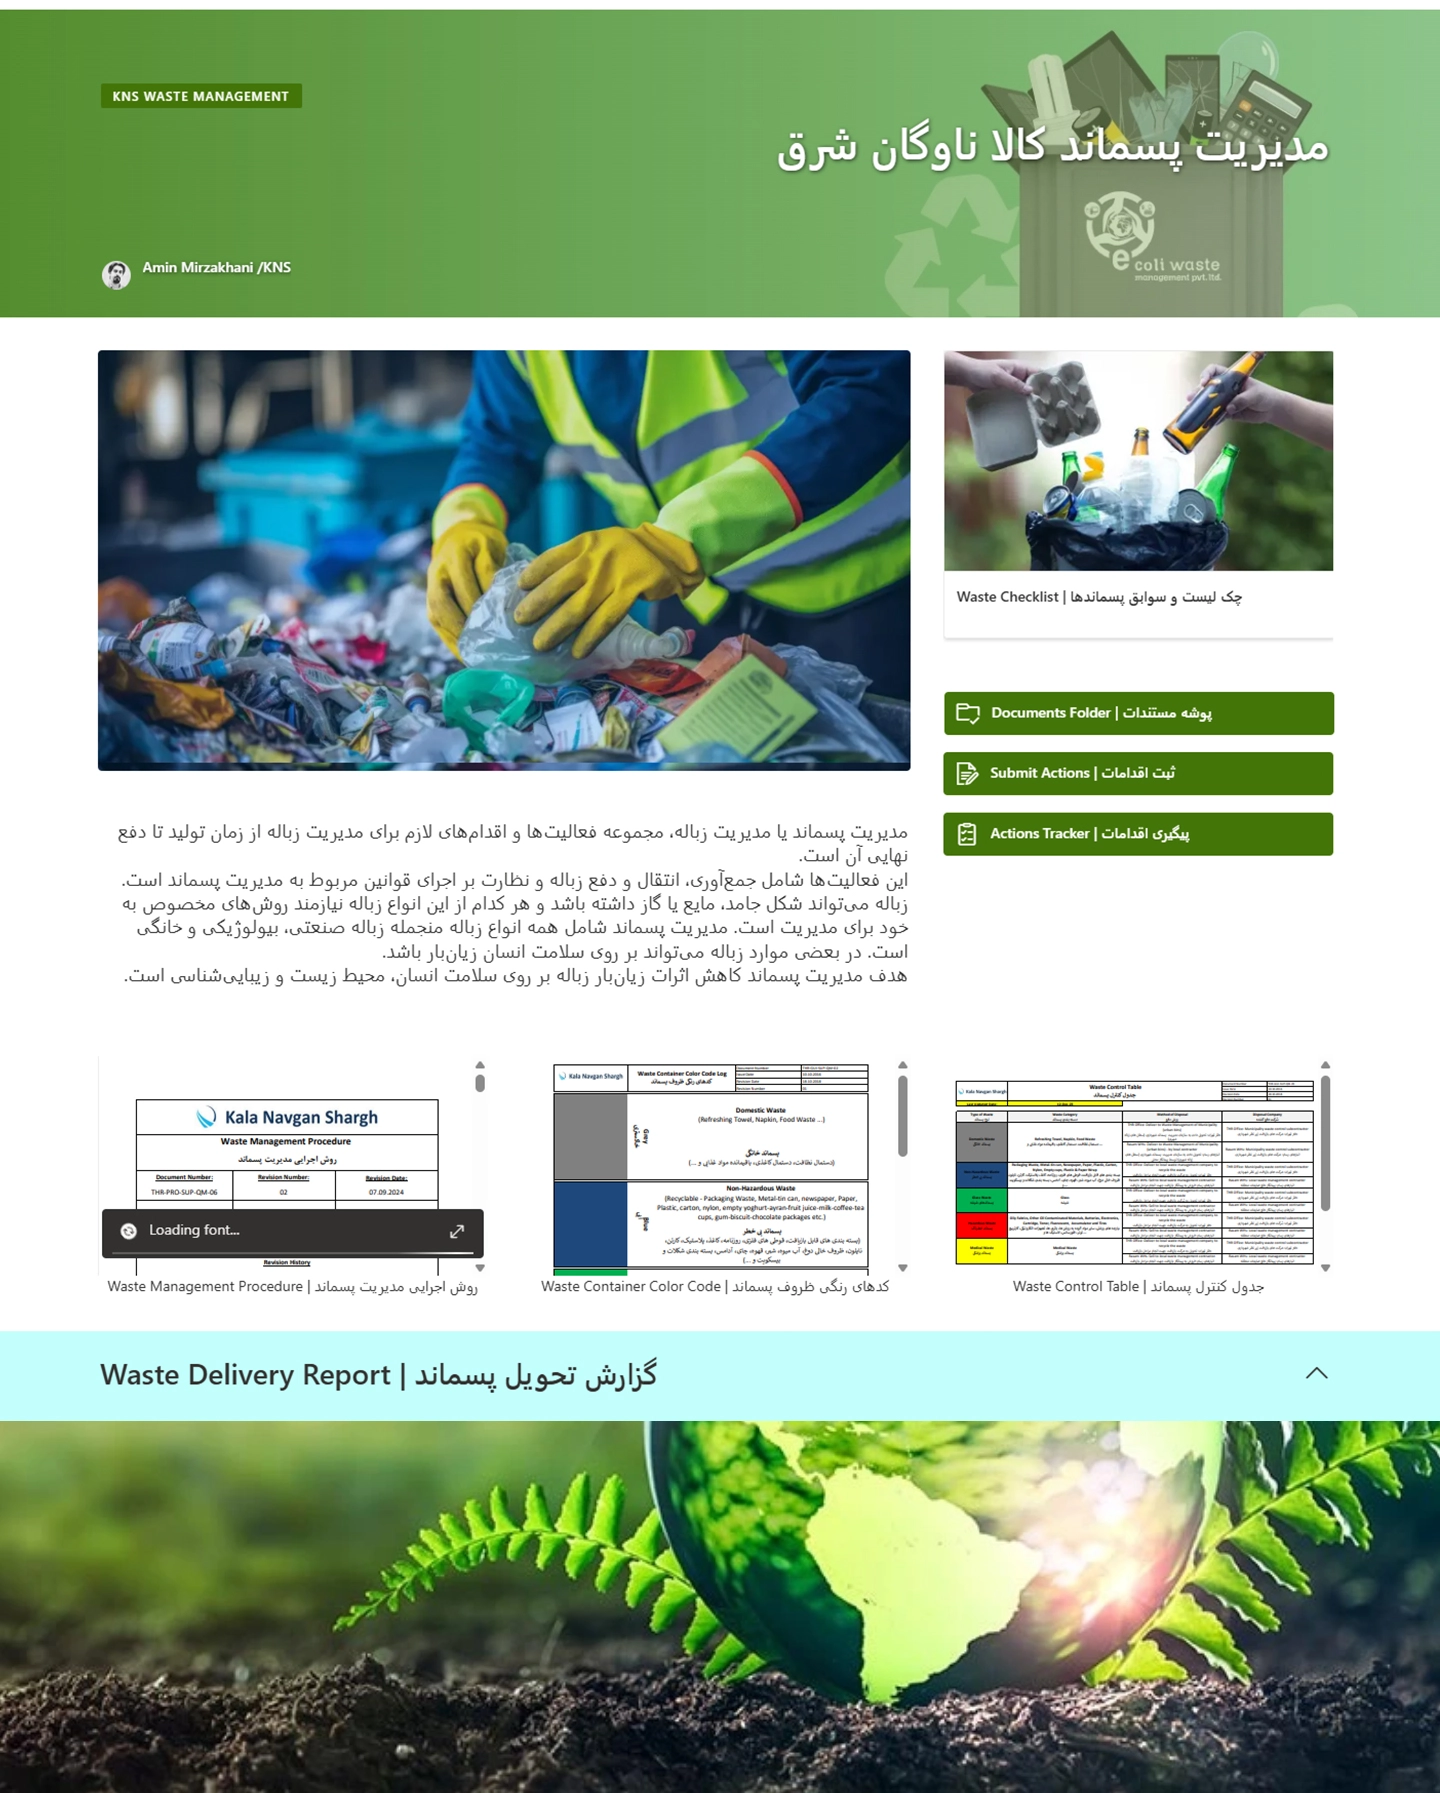
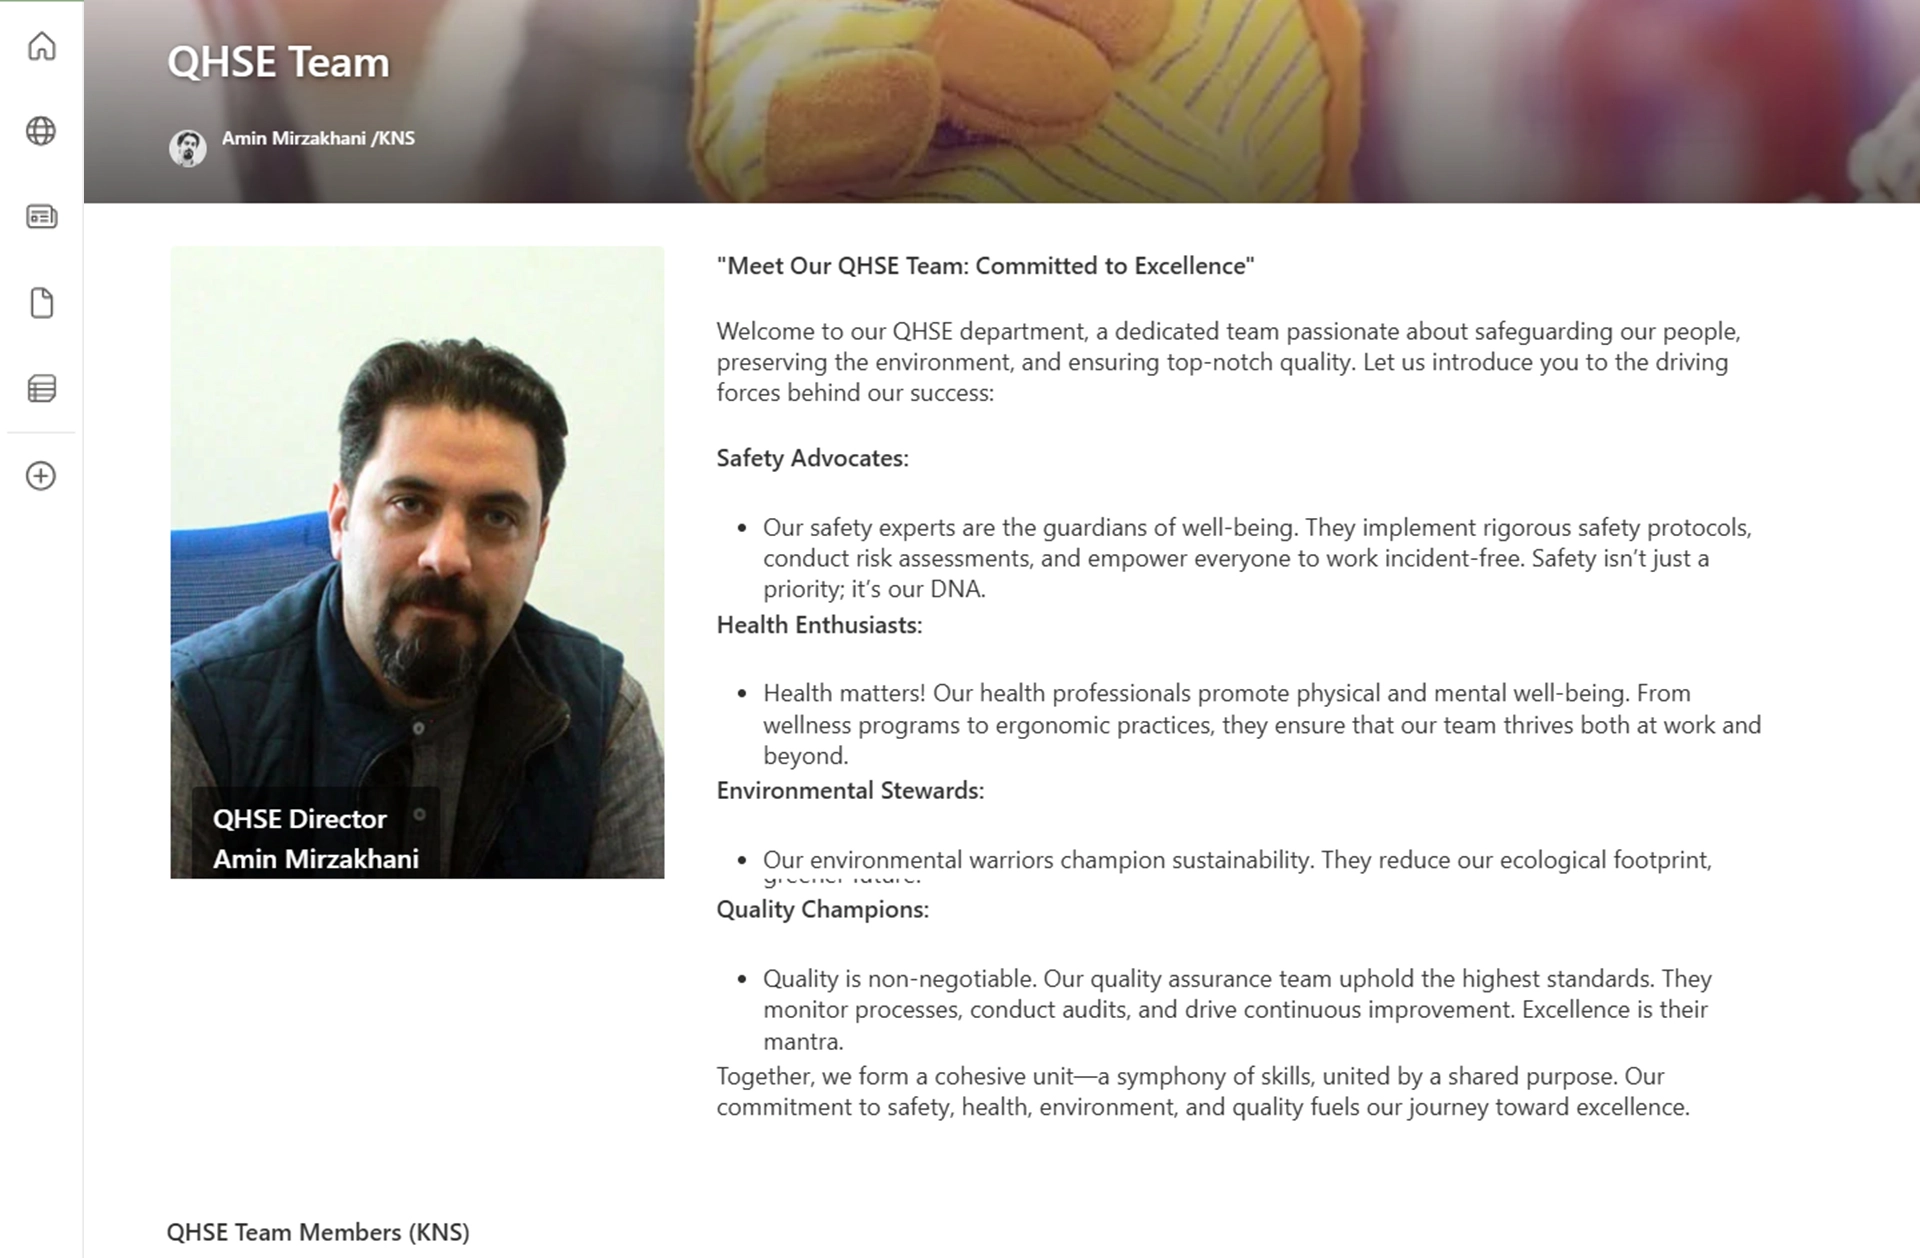
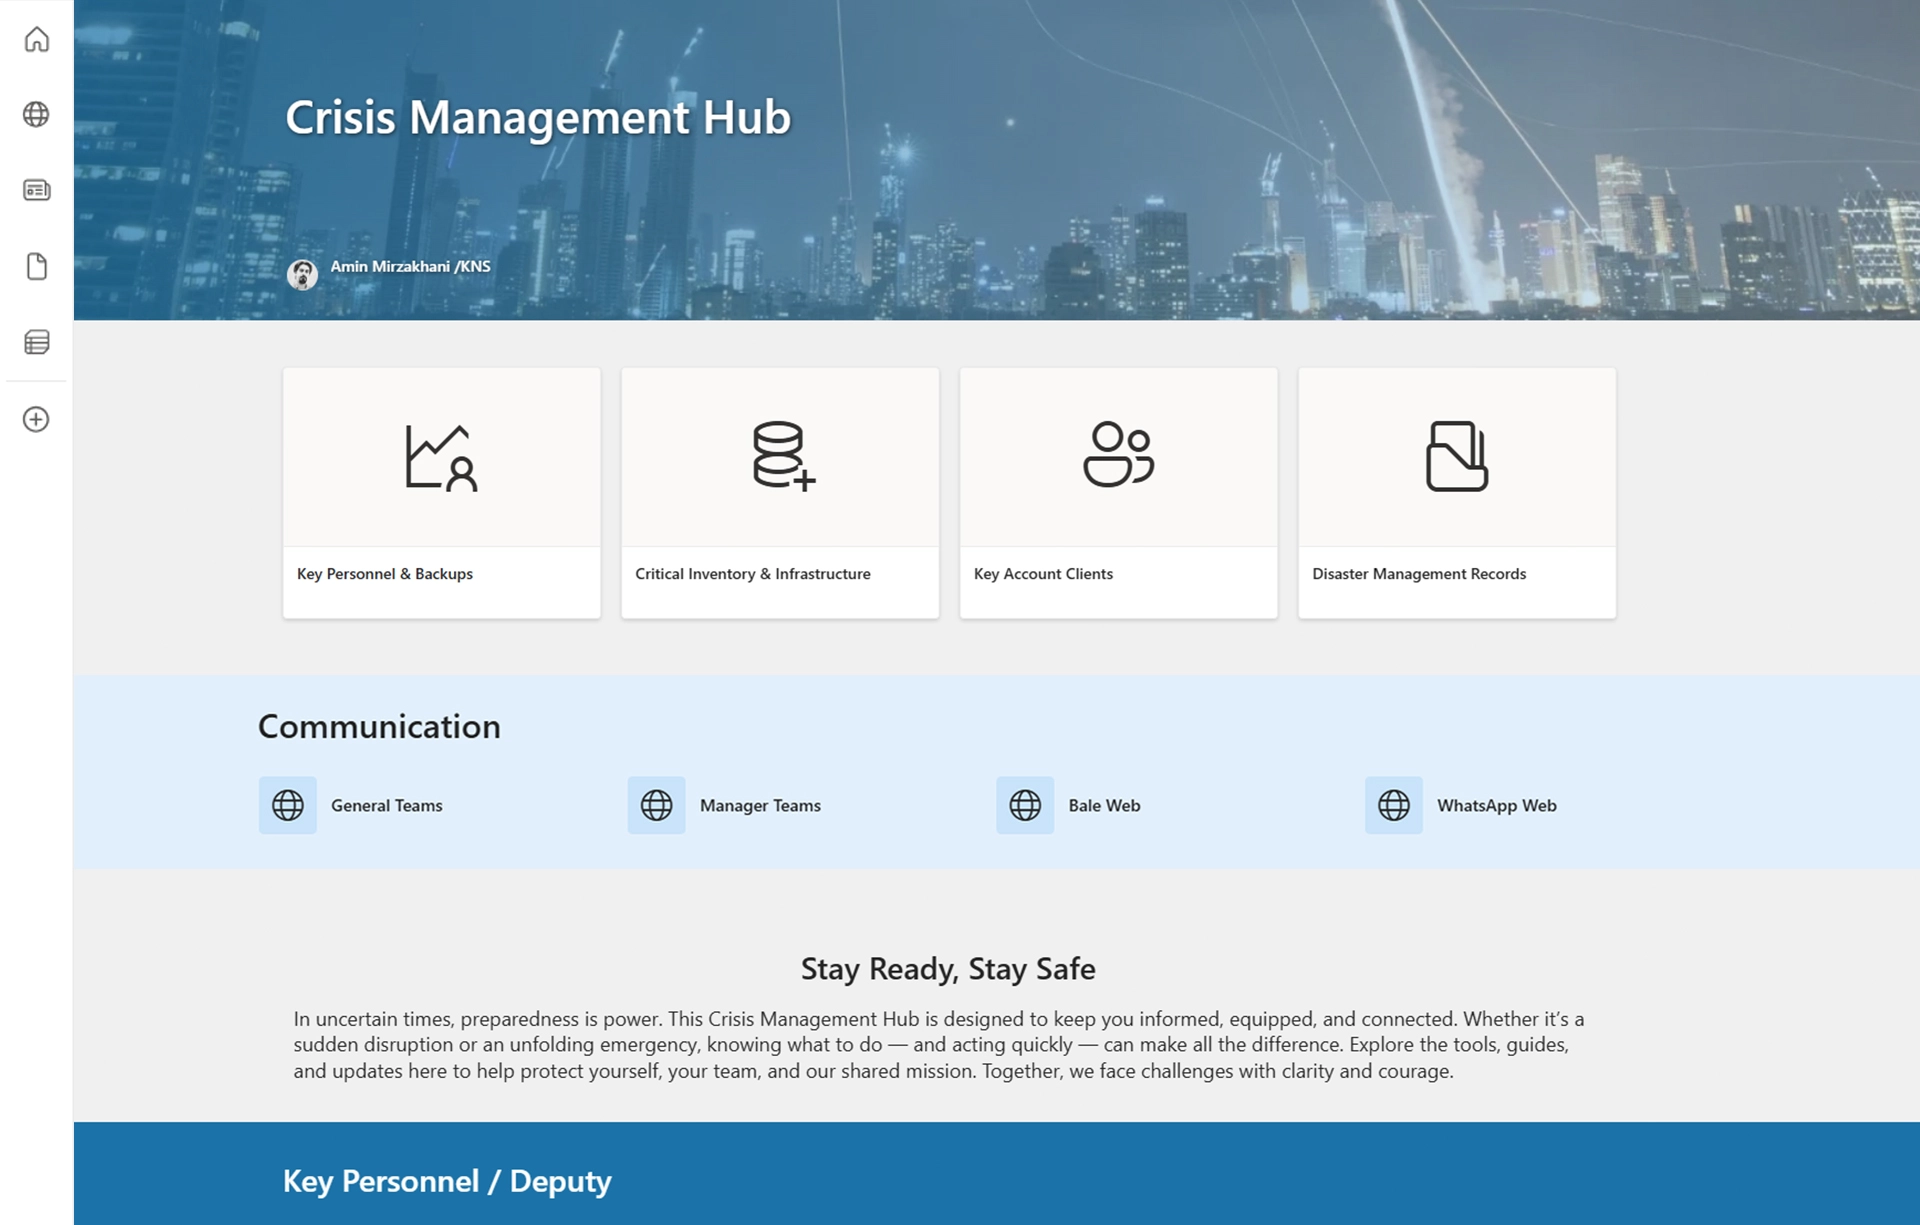
A showcase of SharePoint solutions built to streamline information flow, centralize communication, and create connected digital workplaces. Designed with scalability, usability, and real operational needs in mind.


Intelligence Behind the Interface
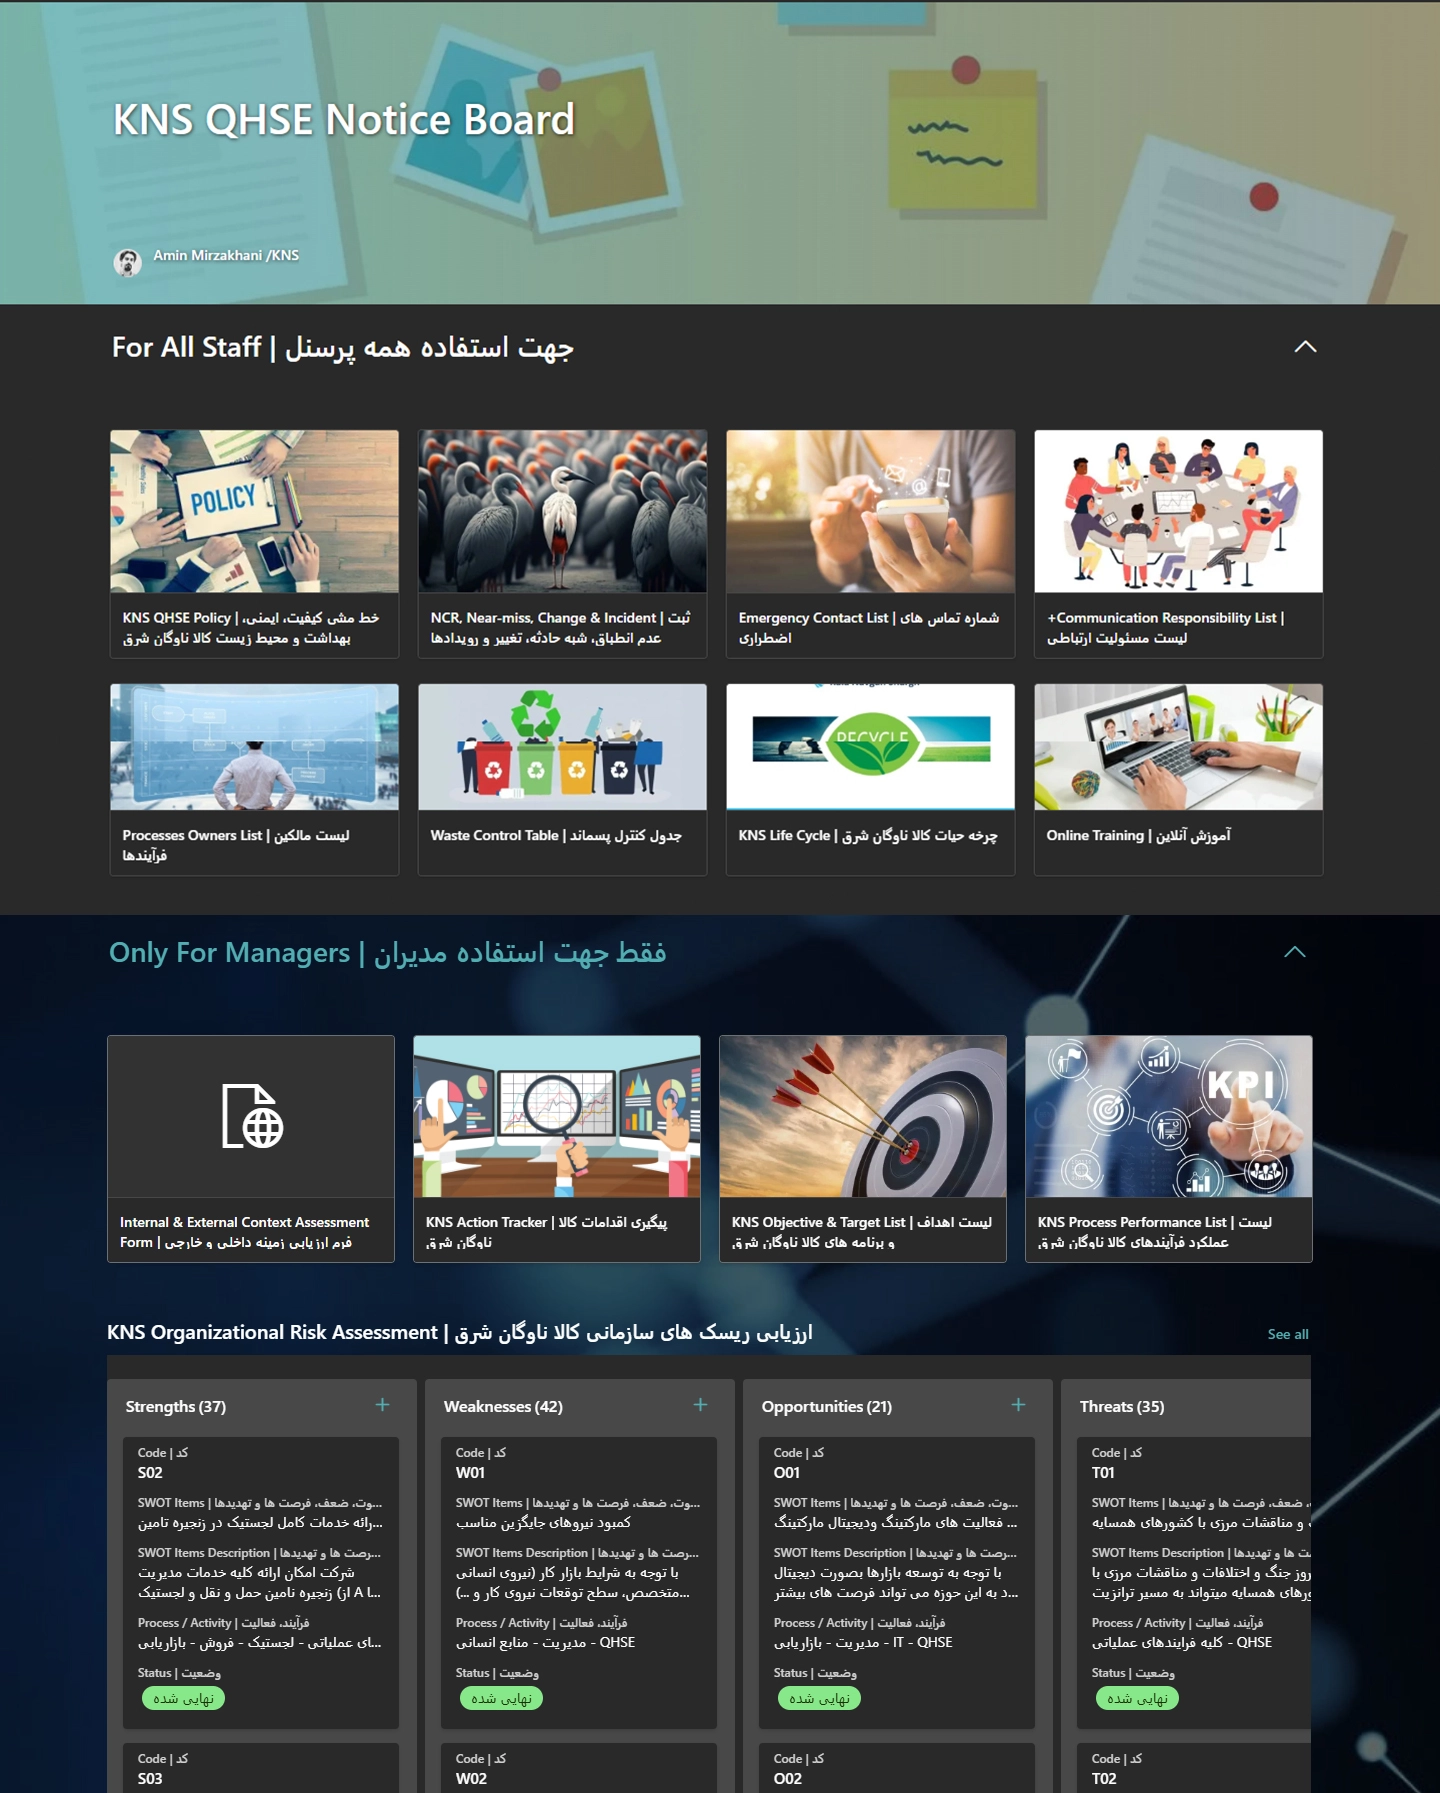
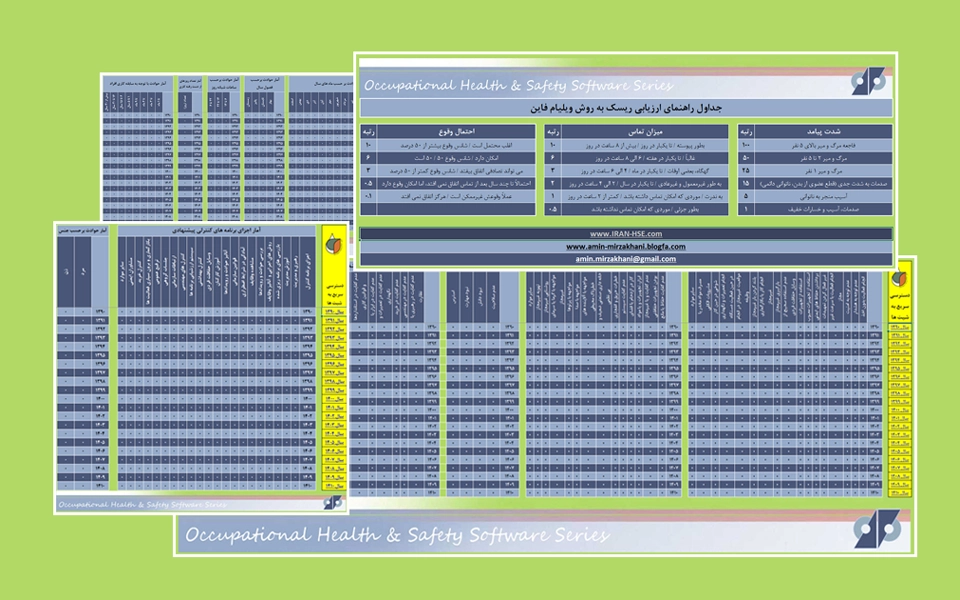
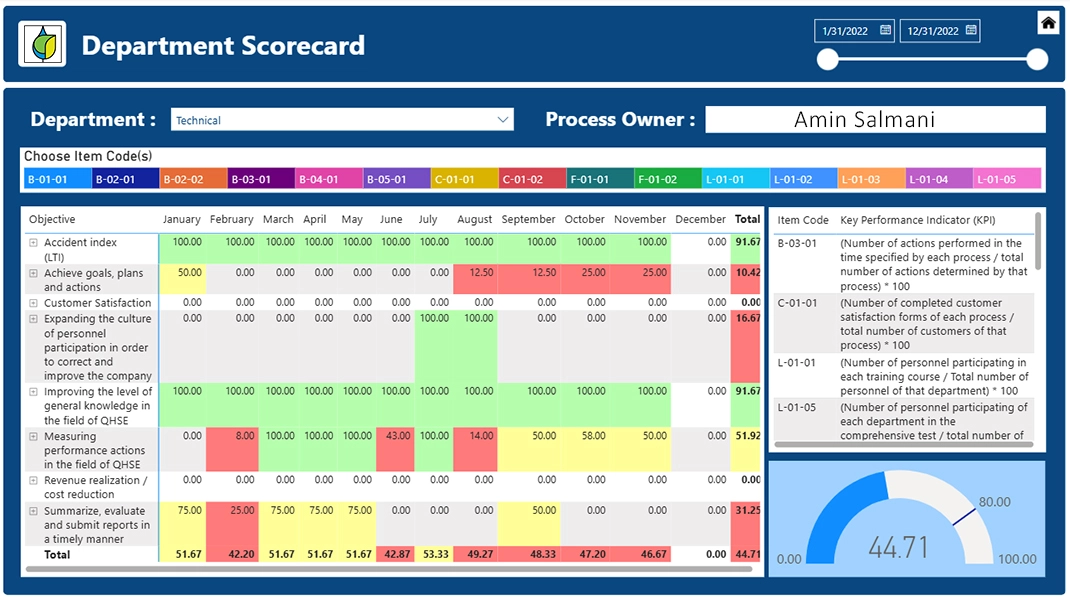
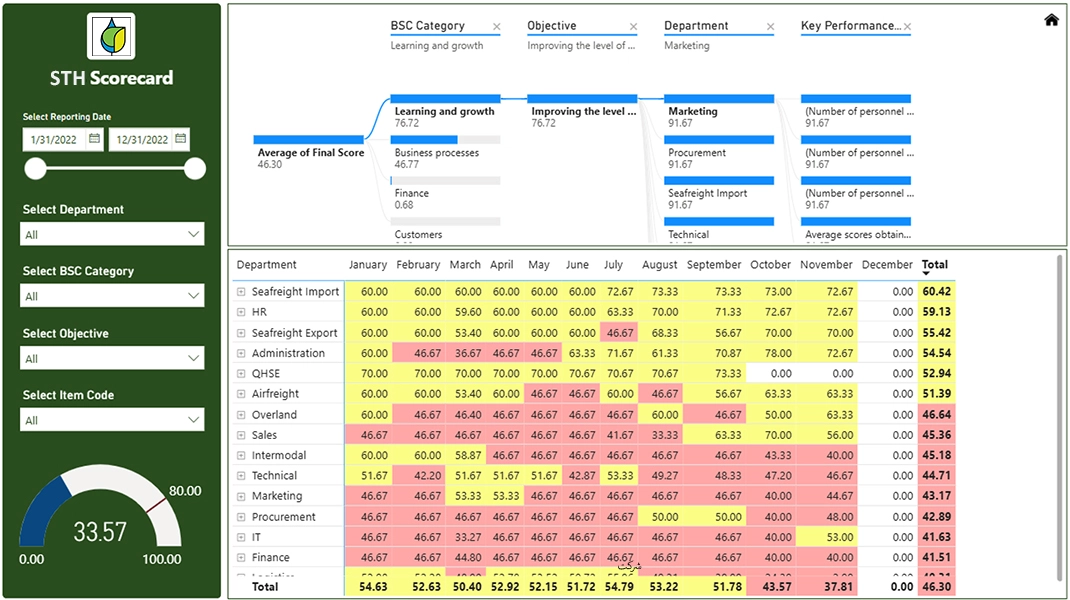
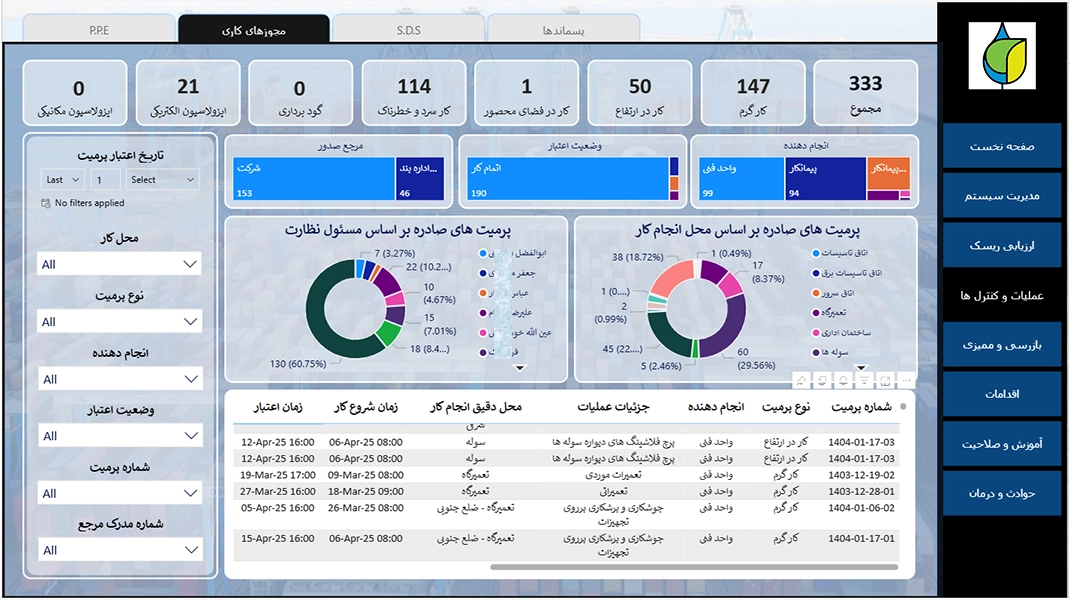
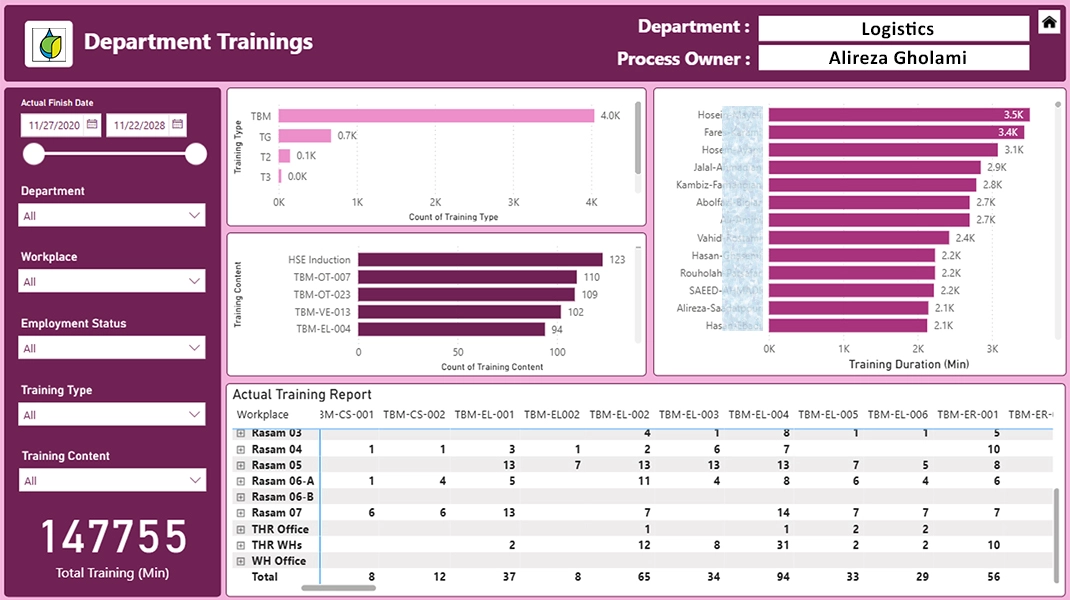
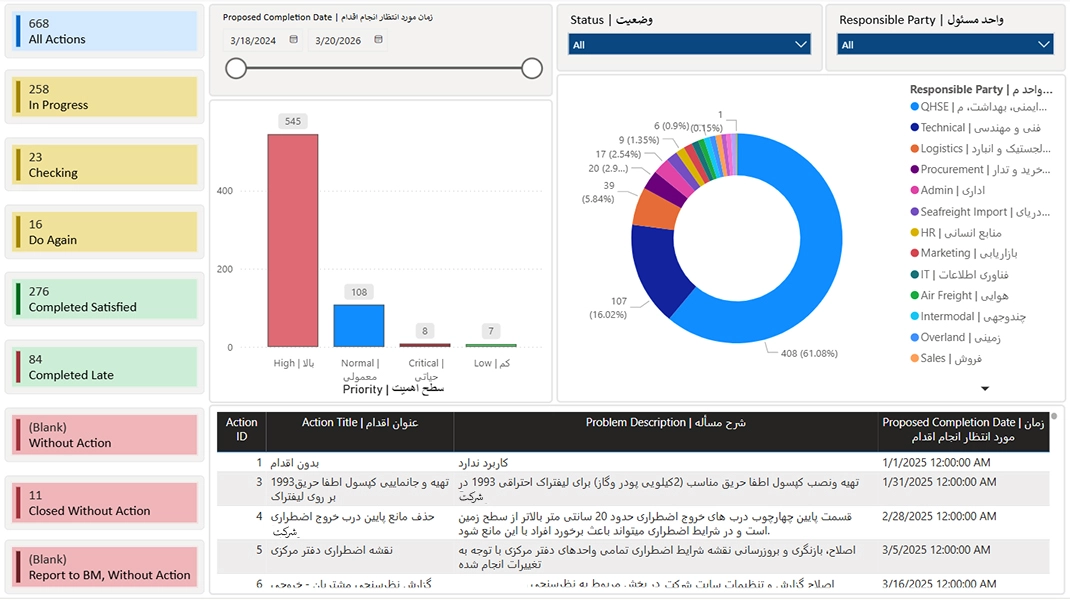
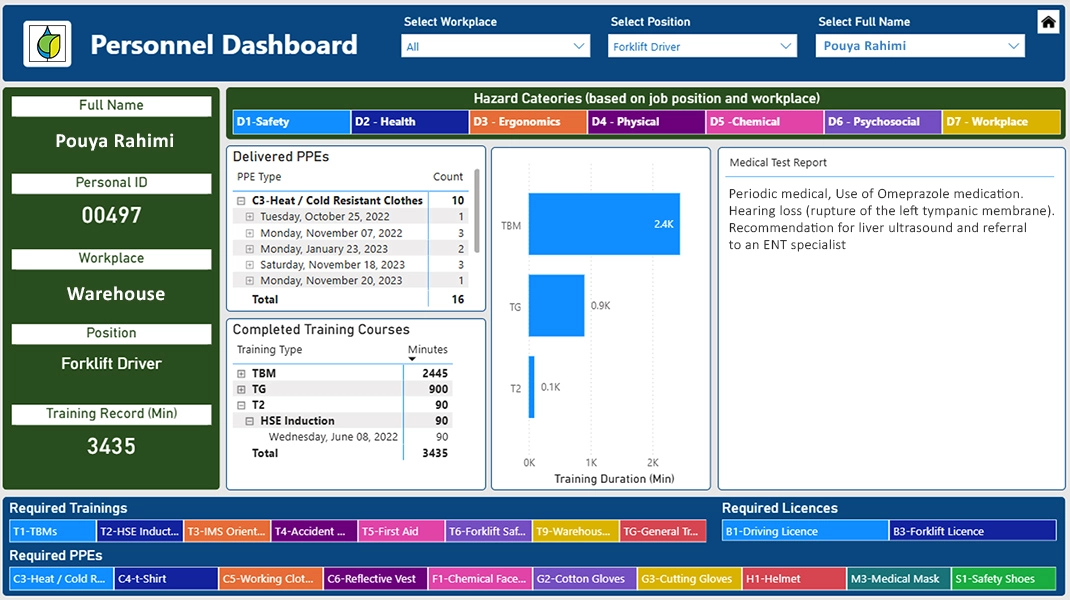
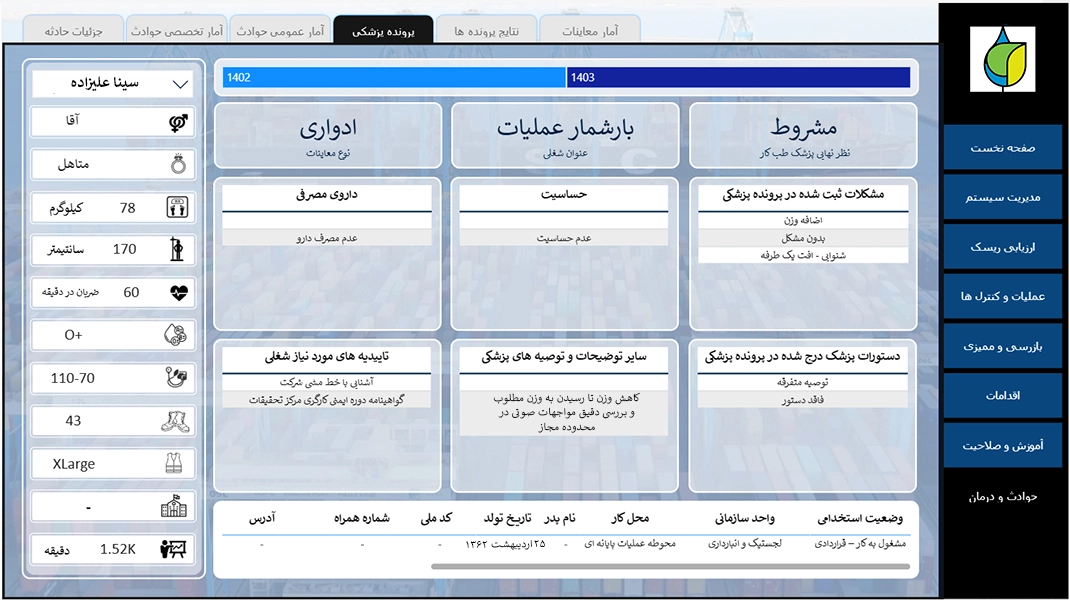
These reports were developed not just to display information, but to support real operational understanding. Each dashboard reflects a balance between data structure, usability, and strategic visibility.

Department Performance Scorecard
Balanced KPI Insights
A management dashboard designed to monitor departmental performance through key performance indicators.
It follows a Balanced Scorecard approach to connect operational results with strategic objectives.
The report helps compare units, track progress and identify performance gaps more clearly.
A practical Power BI solution for turning departmental data into structured management insight.

Safety Data Sheet
Chemical Risk Summary
A printable safety sheet designed to present key chemical hazard information in a clear format.
It allows users to call up each material and generate a ready-to-use workplace safety output.
The layout supports quick access to essential handling, storage, risk and emergency guidance.
A practical reporting solution for displaying chemical safety information where it is needed.

Company Performance Scorecard
Strategic Unit Comparison
A Power BI dashboard designed to compare organizational units through Balanced Scorecard perspectives.
It provides a clear view of performance scores across key strategic and operational dimensions.
The report helps managers identify strengths, gaps and alignment levels between departments.
A structured scorecard solution for seeing company-wide performance in one strategic view.

Permit Management Dashboard
Work Authorization Insights
A Power BI dashboard designed to monitor work permits across locations, responsibilities and validity status.
It provides a clear view of permit distribution, active controls, expired records and operational trends.
The report helps teams identify high-risk areas, follow permit conditions and improve field visibility.
A practical HSE reporting solution for managing work authorization data with better control and insight.

Training Performance Dashboard
Learning Coverage Insights
A Power BI dashboard designed to monitor training delivery across people, topics, departments and locations.
It helps visualize training coverage, participation levels, completed sessions and learning distribution.
The report supports better follow-up on competency development, training gaps and workforce readiness.
A practical analytics solution for turning training records into clear learning and capability insights.

Corrective Action Analytics
Accountability Progress View
A structured dashboard for analyzing actions across responsibility, priority, progress and completion status.
It helps managers review action details, performance trends, overdue items and ownership patterns.
The report supports stronger follow-up, clearer accountability and better closure of improvement tasks.
A useful Power BI solution for managing action plans with visibility, discipline and decision-ready insight.

Individual HSE Profile
Safety Requirement View
A structured dashboard for reviewing individual HSE needs based on role, workplace, hazards and assigned tasks.
It shows required trainings, medical records, PPE allocation, exposure risks and safety-related responsibilities.
Managers can use it to track compliance gaps, personal readiness and worker-specific safety requirements.
A useful Power BI solution for connecting employee records with practical HSE control and decision-making.

Individual Health Profile
Medical Record Insights
A structured dashboard for reviewing personal and medical profile information at an individual level.
It brings together identity details, health records, medical notes and follow-up data in a clear format.
Users can select each person and access a focused view of their related information and record history.
A useful Power BI solution for organizing individual health data into a readable and decision-ready profile.
Building Systems Where Others See Files
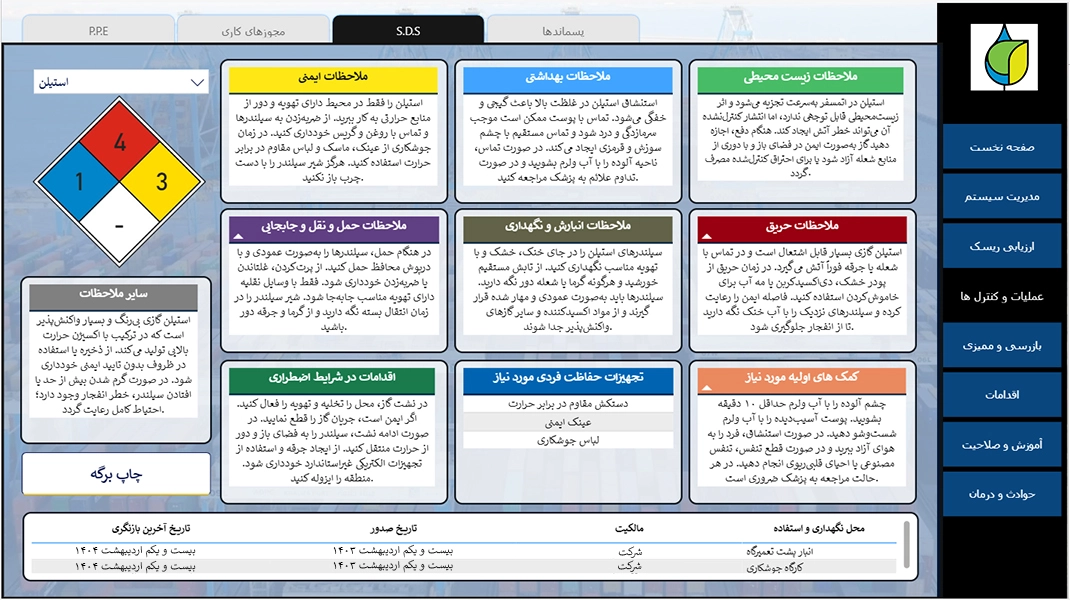
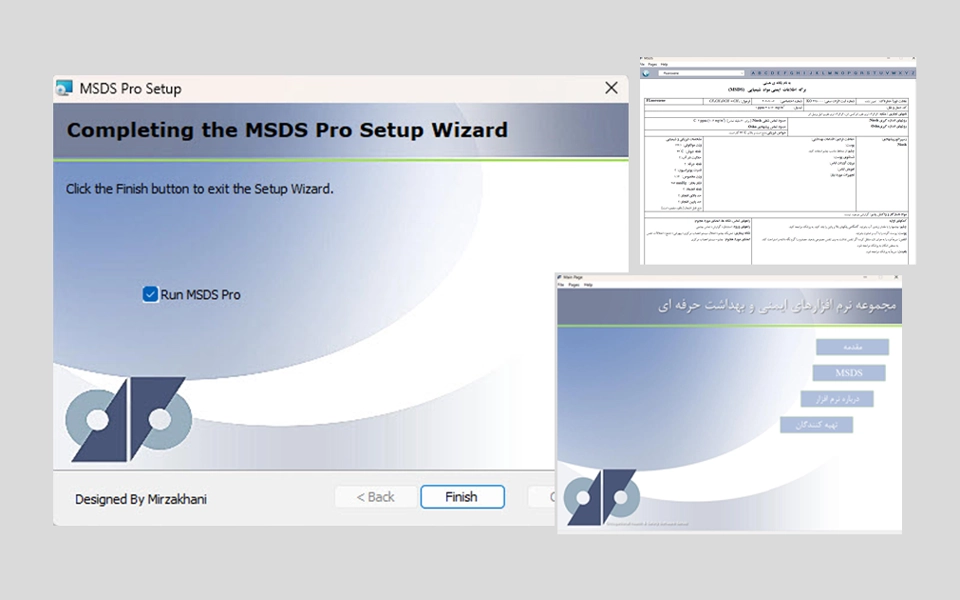
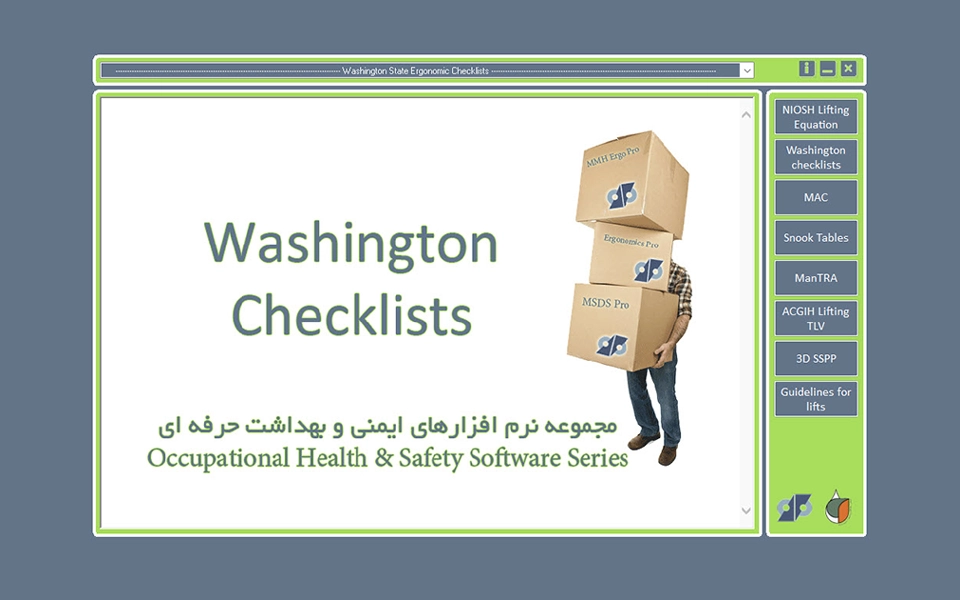
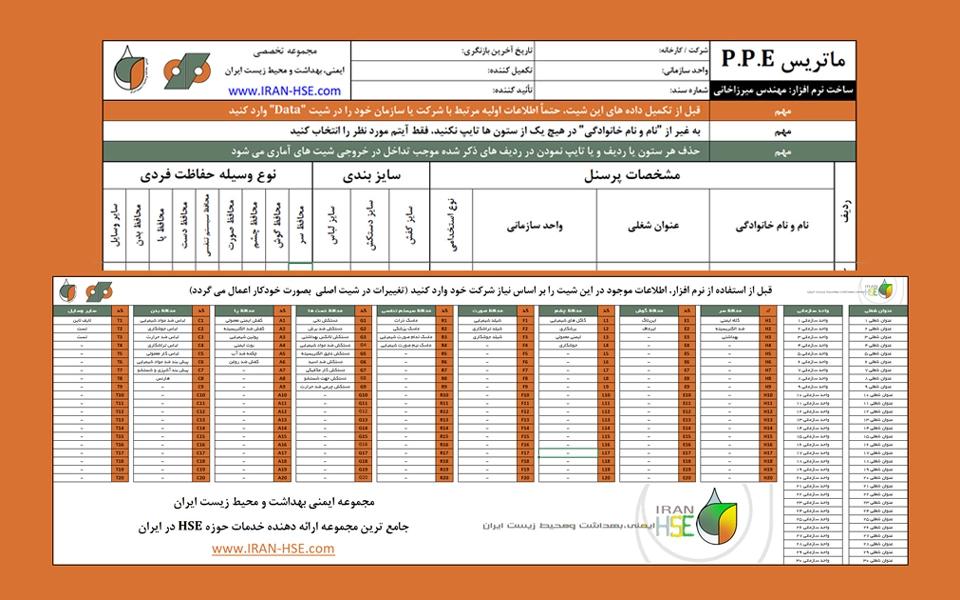
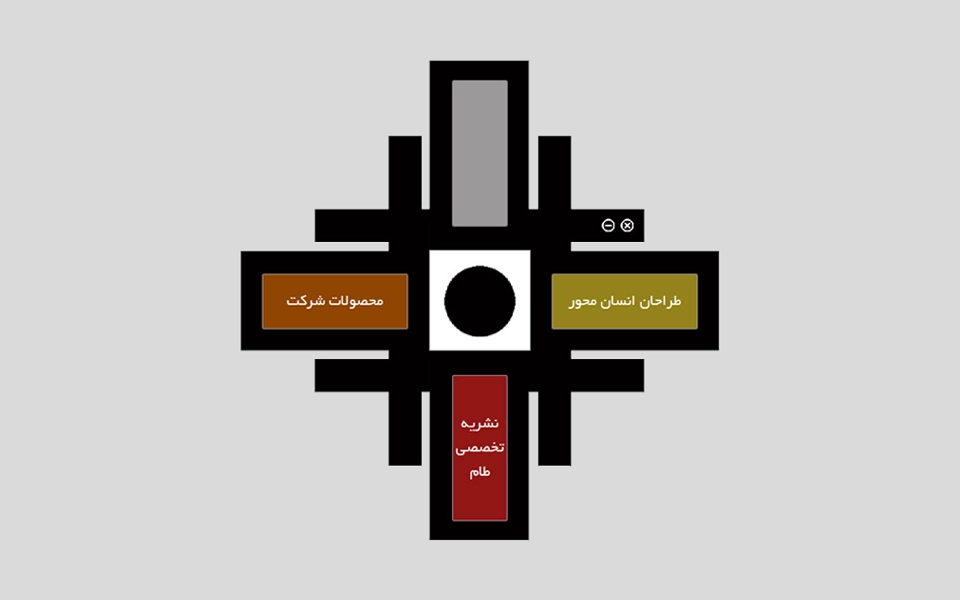
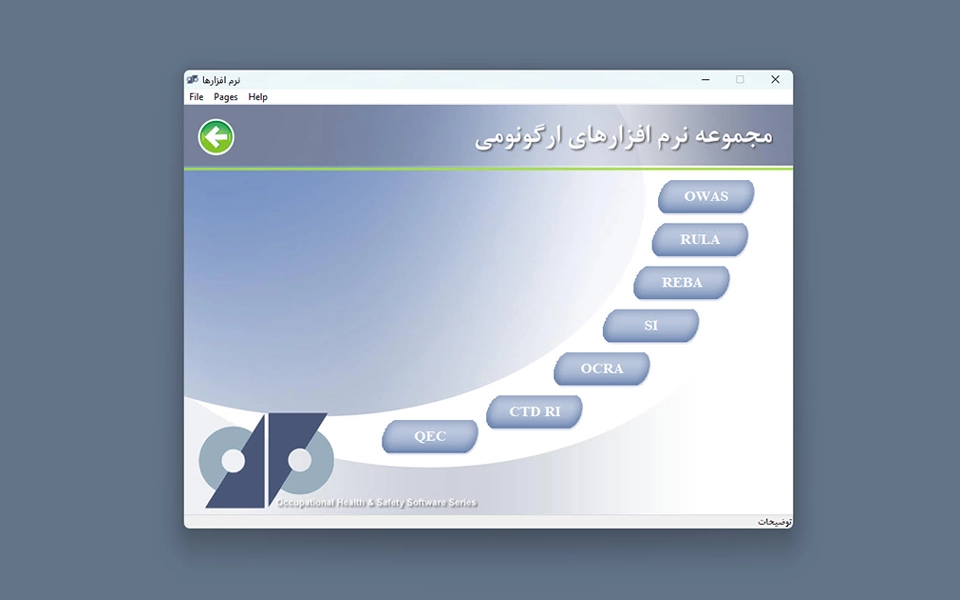
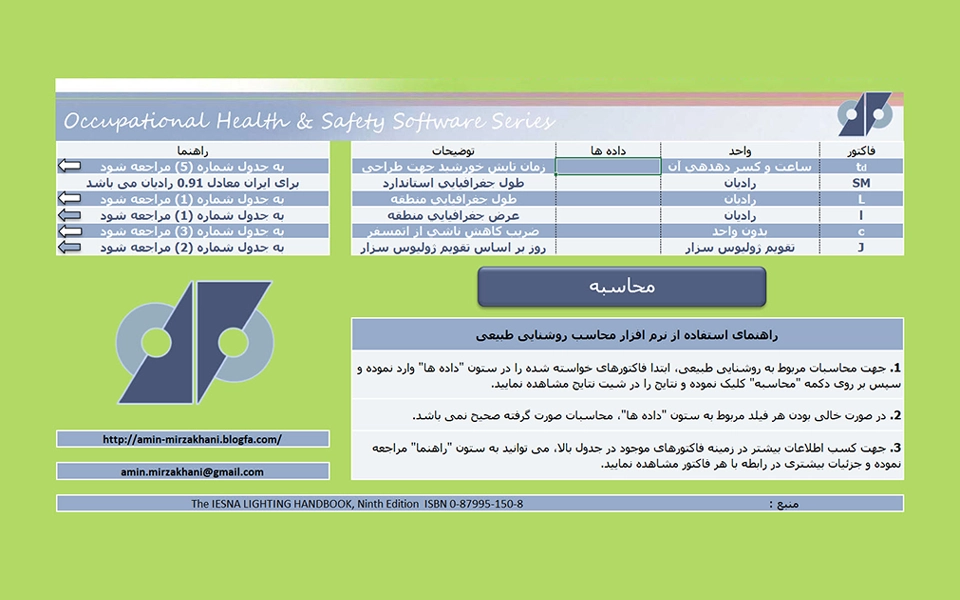
A showcase of custom applications, multimedia solutions, and process-driven tools created with Excel and integrated technologies. Designed to bridge the gap between simplicity, usability, and real organizational needs.


